


You are here
Street Selection Using Self-Organizing Maps
I chose the paper Selection of Streets from a Network Using Self-Organizing Maps as the basis of my final project for the GIS grad course (COMP 5204) I took fall 2007. I implemented a simple street selection demo application based on the research described within the paper using Java and some open source libraries.
There are two levels of work to be done when determining what roads should be shown at a particular level of detail. This whole process is known as generalization, since we must decide what subset of all the available information will be shown.
The first step of generalization involves examining the model of the road network and using information about street connections, types, and so on to pick out the most important or relevant pieces to show.
Once we have the data that is to be visualized, the second step analyzes the geometric properties of the chosen roads and uses the results to simplify the graphical rendering of the roads. For example, a road with many small bends that can't be rendered onto the screen as such will be simplified to a straight line instead.
It is in the first step that self-organizing maps (or SOMs) can play a role. These maps are actually neural networks that are used to cluster and visualize data. To make a longish story short (and simplified), you create vectors with as many dimensions as you have numerical properties about each item you want to cluster. Using these numbers, the SOM sorts out the data so that items that are most alike end being "close" together. You might, for example, have a SOM that is represented by a two dimensional grid, and the input vectors will be organized into the cells based on their similarities.
In the case of selecting roads from a network, there are some obvious numerical values that can be used to describe each street for use in the SOM, such as length. There are, however, also some less obvious choices that seem to help categorize roads in a more useful way. A good list of attributes for each road is as follows:
- Number of streets that intersect this one
- A measure of closeness between this road and all others around it, using shortest path distances
- A measure of betweenness, the proportion of shortest paths between all other roads that pass through this one
- Length and width (i.e. number of lanes)
- A numerical representation of the class of road (i.e. avenue, street, highway, freeway, etc)
- Speed limit
Using these properties, roads can be clustered into a SOM. We can then pick a group of similar roads very easily. If we are careful about using the numerical properties so that when the value increases, so does the corresponding importance of the road, we can simply pick the SOM cells with the highest average values for the vectors stored within. These roads will be used in the map's final generalization.
The main component of the project's implementation is the GeoTools open source Java Toolkit. This library is fully featured for the general manipulation of geospatial data and adheres to the OpenGIS® Specifications. It is capable of opening several common data formats including ESRI shapefiles, geography markup language, and PostGIS, and has built in rendering capabilities.
JavaSOM is the implementation component of a student's work. It is a basic self-organizing map library that supports input and output of data via XML files.
Looking to the shapeReader package, the main starting point of the implementation is the ShapeFile class. It can load an ESRI shapefile and provide access to the features found within. In the example test run, a shapefile from Statistics Canada was obtained. The file contains a road network for the province of Ontario.
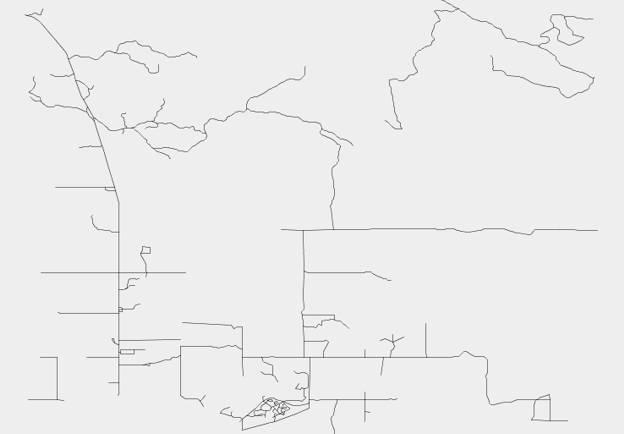
The AreaOfInterest class facilitates a new view of a set of features filtered either by geometric bounds or a list of feature identifiers. The example creates an instance of this class in order to work with a smaller set of data (the original file has 473,252 features and the new interest contains just 239). The area of interest can be rendered from this class as well. The screenshot below shows the road network contained in the example's area of interest.
The shapeReader.graph package contains classes that are used to build a connectivity graph from a set of features and extract information about the graph (namely, degree, closeness, and betweenness). The graph is implemented as a part of the GeoTools graph framework, and as such, the algorithms for computing this information are limited by the capabilities of GeoTools.
Finally, the streetClassifier package contains the main driver for the street selection. The main class of note here is the StreetSelector class. It can perform the whole process beginning with an area of interest and a percentage of important roads to select. A new area of interest with only the selected streets is returned. The next screenshot shows a reduced map with the top 80% of roads selected.
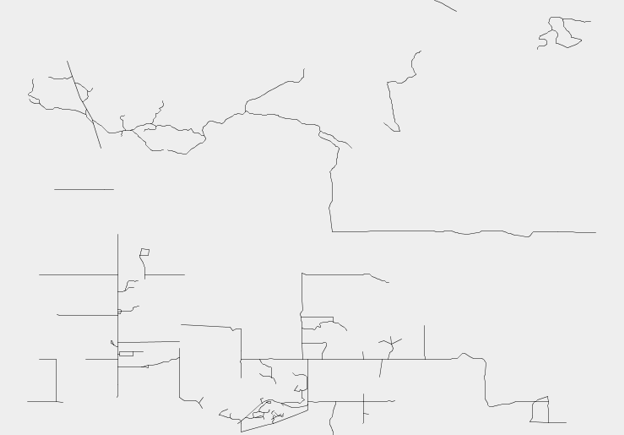
Most of the general shape has been preserved. There are some improvements that can be made to my impementation, particularly the classification of roads, which I had to do somewhat arbitrarily. Somebody with more knowledge could certainly provide a better assignment of numerical values to the various classes.
For more information , check out the blog post I made about this project, and then have a look at the project paper.